Visualizing Your Git Repository
About half of my interactions with Git take place on the command line. But when I want to understand what's going on, I use a visual Git tool. I still use GitX, but in the years since I first wrote this site, several other tools have been released. Use whatever works for you.
The main point of using a visualizer is to help you make sense of your branch history. For example, to list all commits in your repository at the command line, you could do git log --oneline --abbrev-commit --all—which will get you this flattened view:
(Thanks to @cflipse for pointing out that --pretty=oneline --branches=* could be shortened to --oneline --all!)
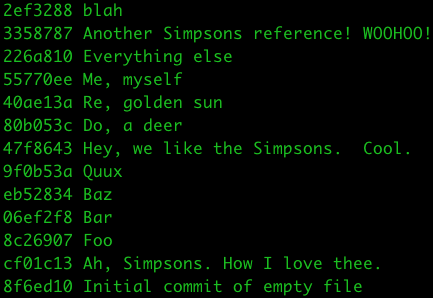
Clear as mud, right?
Or, you can add --graph to that command, which will show you a slightly more useful view:
git log --oneline --abbrev-commit --all --graph
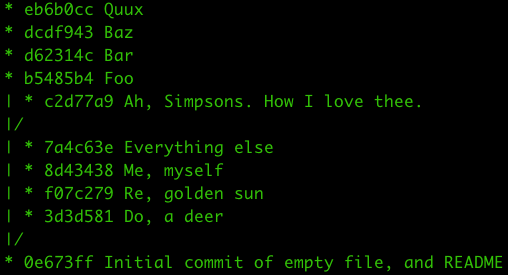
Much better!
(Thanks to @mjdominus and @JRGarcia for reminding me about the --graph option!)
If you want to see branch and tag labels, add --decorate:
git log --oneline --abbrev-commit --all --graph --decorate
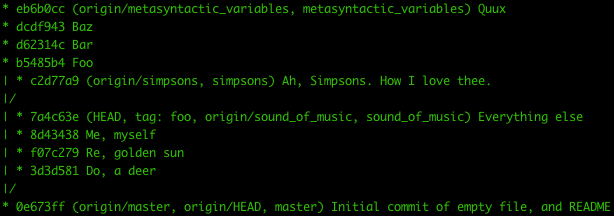
I'm going to need a wider design template if this goes on...
(Thanks again to @JRGarcia for the --decorate tip!)
You can also add --color to pretty up the display a bit more (sorry, no time to take a screenshot as I add this):
git log --oneline --abbrev-commit --all --graph --decorate --color
And, in fact, I have a shell alias in my dotfiles repository that does all of this:
alias gg='git log --oneline --abbrev-commit --all --graph --decorate --color'
Or, as an anonymous reader points out, you can set up a Git alias to do the same thing:
git config --global alias.graph "log --graph --oneline –decorate=short"
But mostly, I just use GitX, which shows all of the same information in a cleaner graphical view:
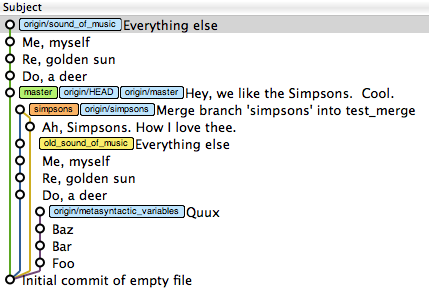
I like the purdy colors.
- About This Site
- Git Makes More Sense When You Understand X
- Example 1: Kent Beck
- Example 2: Git for Ages 4 and Up
- Example 3: Homeomorphic Endofunctors
- Example 4: LSD and Chainsaws
- The Internet Talks Back!
- Graph Theory
- Seven Bridges of Königsberg
- Places To Go, and Ways to Get There
- Nodes and Edges
- Attaching Labels to Nodes
- Attaching Labels to Edges
- Directed Versus Undirected Graphs
- Reachability
- Graphs and Git
- Visualizing Your Git Repository ←HEAD
- References
- The Reference Reference
- Making Sense of the Display
- Garbage Collection
- Experimenting With Git
- References Make Commits Reachable
- My Humble Beginnings
- Branches as Savepoints
- Use Your Targeting Computer, Luke
- Testing Out Merges
- Rebase From the Ground Up
- Cherry-Picking Explained
- Using 'git cherry-pick' to Simulate 'git rebase'
- A Helpful Mnemonic for 'git rebase' Arguments
- The End
